If you use ggdendrogram() to create your plot, the
resulting object is a ggplot. You have full control over
this using any function available in ggplot.
First create an example dataset.
Plot the default ggdendrogram() output:
ggdendrogram(hc, rotate = FALSE, size = 2)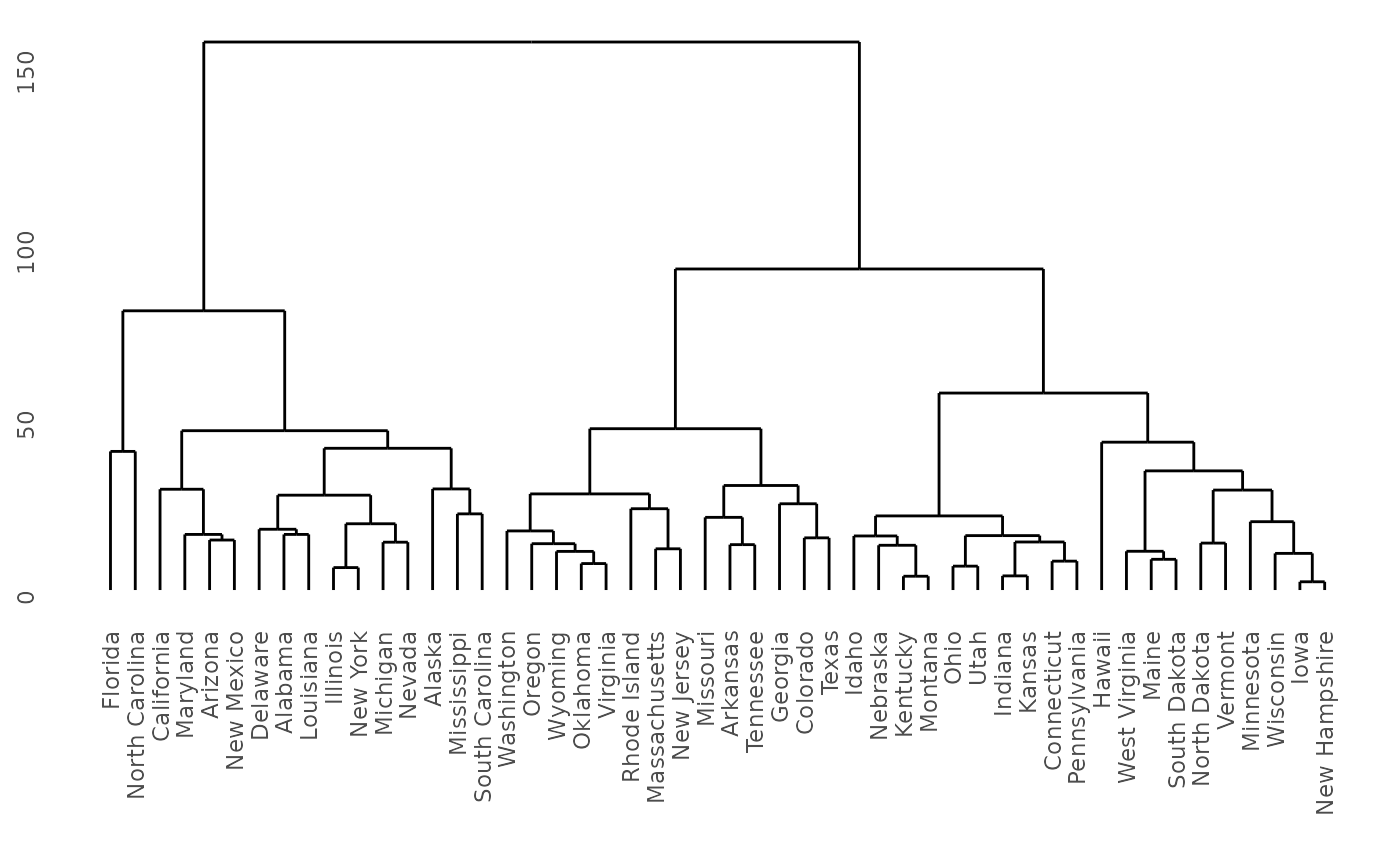
Use a different theme:
ggdendrogram(hc, rotate = FALSE, size = 2) +
  theme_bw()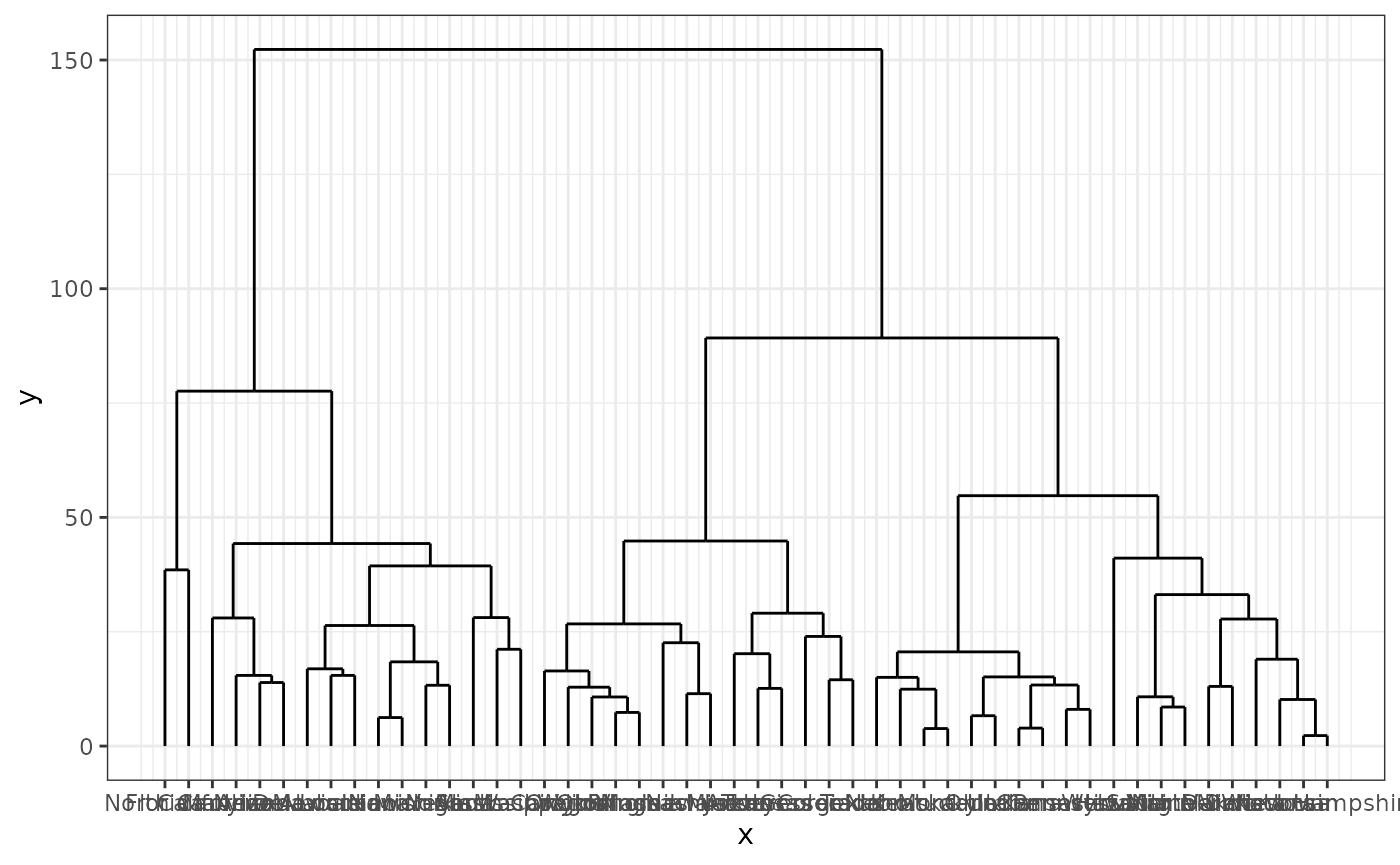
Or modify just one element, for example add a y-axis.
ggdendrogram(hc, rotate = FALSE, size = 2) +
  theme( axis.line.y = element_line() )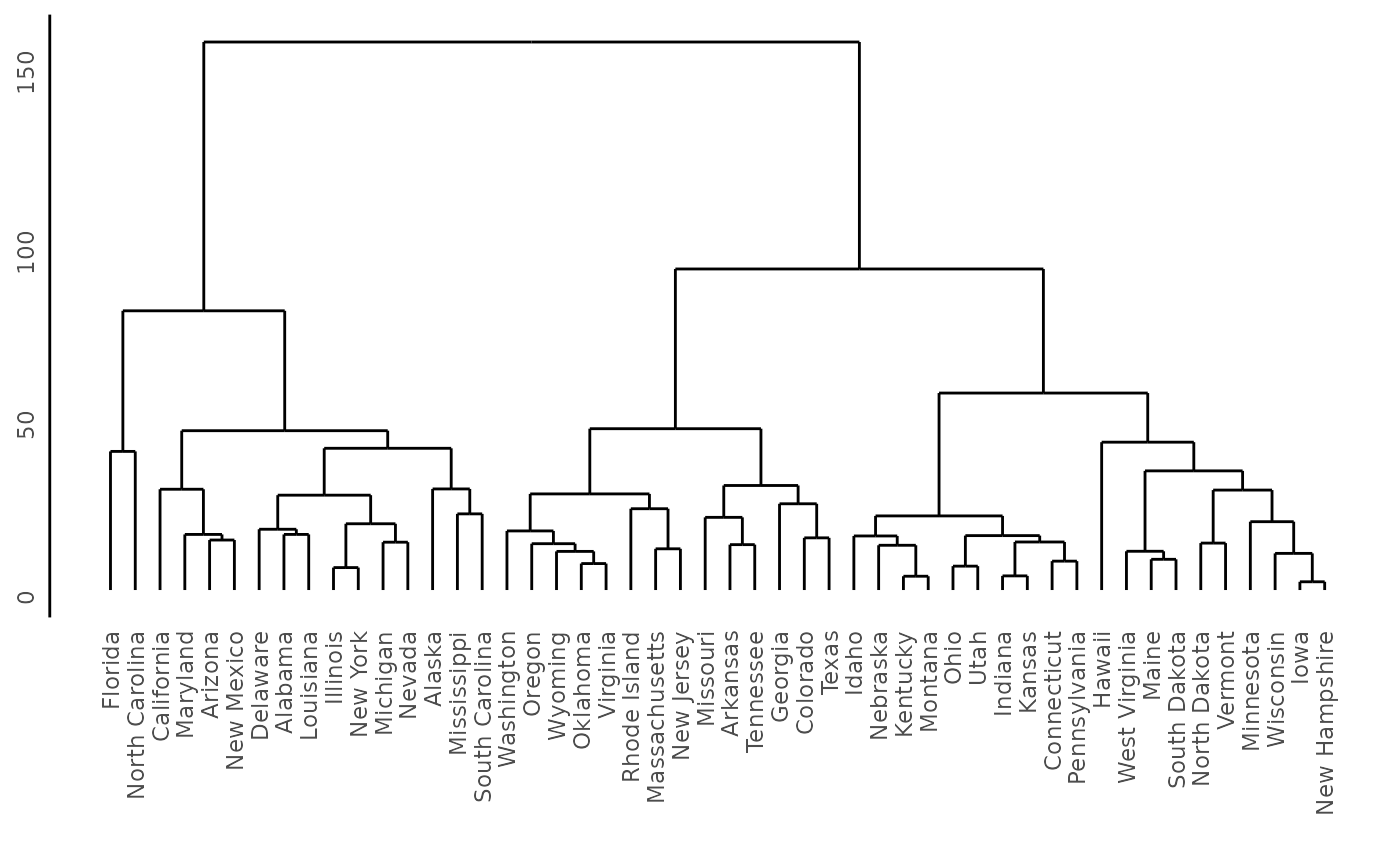
In summary, ggdendrogram() is a convenience function
that creates a ggplot. Once you have this plot, you can
modify the plot using tools that you are familiar with.