Extract cluster data from a model into a list of data frames.
Source:R/dendro_data.R, R/dendrogram.R
dendro_data.RdThis function provides a generic mechanism to extract relevant plotting data, typically line segments and labels, from a variety of cluster models.
Extract line segment and label data from stats::dendrogram() or
stats::hclust() object. The resulting object is a list of data frames
containing line segment data and label data.
Usage
dendro_data(model, ...)

# S3 method for default
dendro_data(model, ...)

# S3 method for dendrogram
dendro_data(model, type = c("rectangle", "triangle"), ...)

# S3 method for hclust
dendro_data(model, type = c("rectangle", "triangle"), ...)

# S3 method for twins
dendro_data(model, type = c("rectangle", "triangle"), ...)
Arguments
- model
object of class "dendrogram", e.g. the output of as.dendrogram()
- ...
ignored
- type
The type of plot, indicating the shape of the dendrogram. "rectangle" will draw rectangular lines, while "triangle" will draw triangular lines.
Value
a list of data frames that contain the data appropriate to each cluster model
A list with components:
- segments
Line segment data
- labels
Label data
Details
For stats::dendrogram() and tree::tree() models, extracts line segment
data and labels.
See also
There are several implementations for specific cluster algorithms:
dendro_data.hclust()dendro_data.dendrogram()
To extract the data for line segments, labels or leaf labels use:
segment(): the line segment datalabel(): the text for each end segmentleaf_label(): the leaf labels of a tree diagram
Other dendro_data methods:
dendro_data.rpart(),
dendro_data.tree(),
dendrogram_data(),
rpart_labels()
Other dendrogram/hclust functions:
dendrogram_data()
Examples
require(ggplot2)
#> Loading required package: ggplot2
### Demonstrate dendro_data.dendrogram
model <- hclust(dist(USArrests), "ave")
dendro <- as.dendrogram(model)
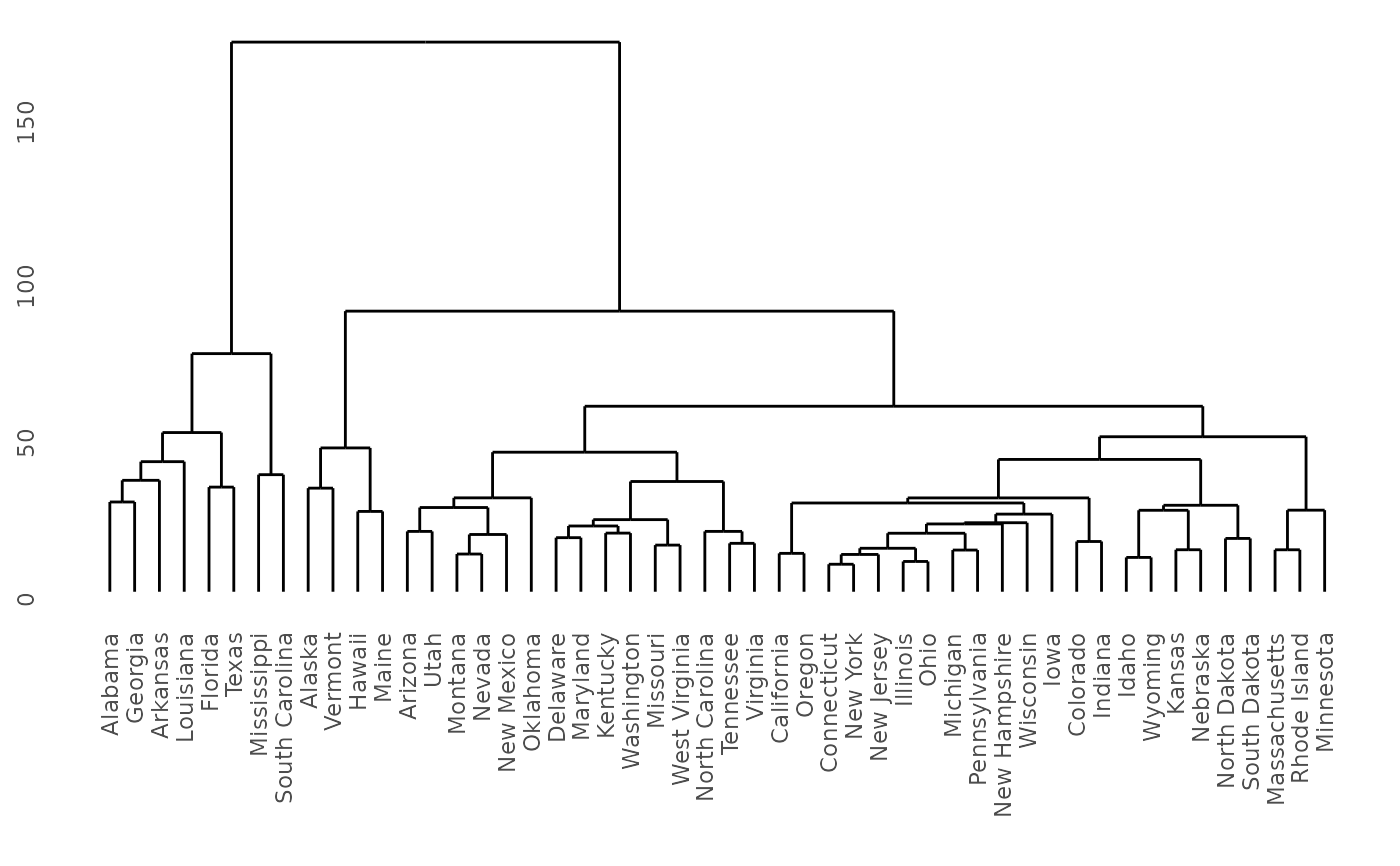
# Rectangular lines
ddata <- dendro_data(dendro, type = "rectangle")
ggplot(segment(ddata)) +
geom_segment(aes(x = x, y = y, xend = xend, yend = yend)) +
coord_flip() +
scale_y_reverse(expand = c(0.2, 0)) +
theme_dendro()
 # Triangular lines
ddata <- dendro_data(dendro, type = "triangle")
ggplot(segment(ddata)) +
geom_segment(aes(x = x, y = y, xend = xend, yend = yend)) +
theme_dendro()
# Triangular lines
ddata <- dendro_data(dendro, type = "triangle")
ggplot(segment(ddata)) +
geom_segment(aes(x = x, y = y, xend = xend, yend = yend)) +
theme_dendro()
 # Demonstrate dendro_data.hclust
require(ggplot2)
hc <- hclust(dist(USArrests), "ave")
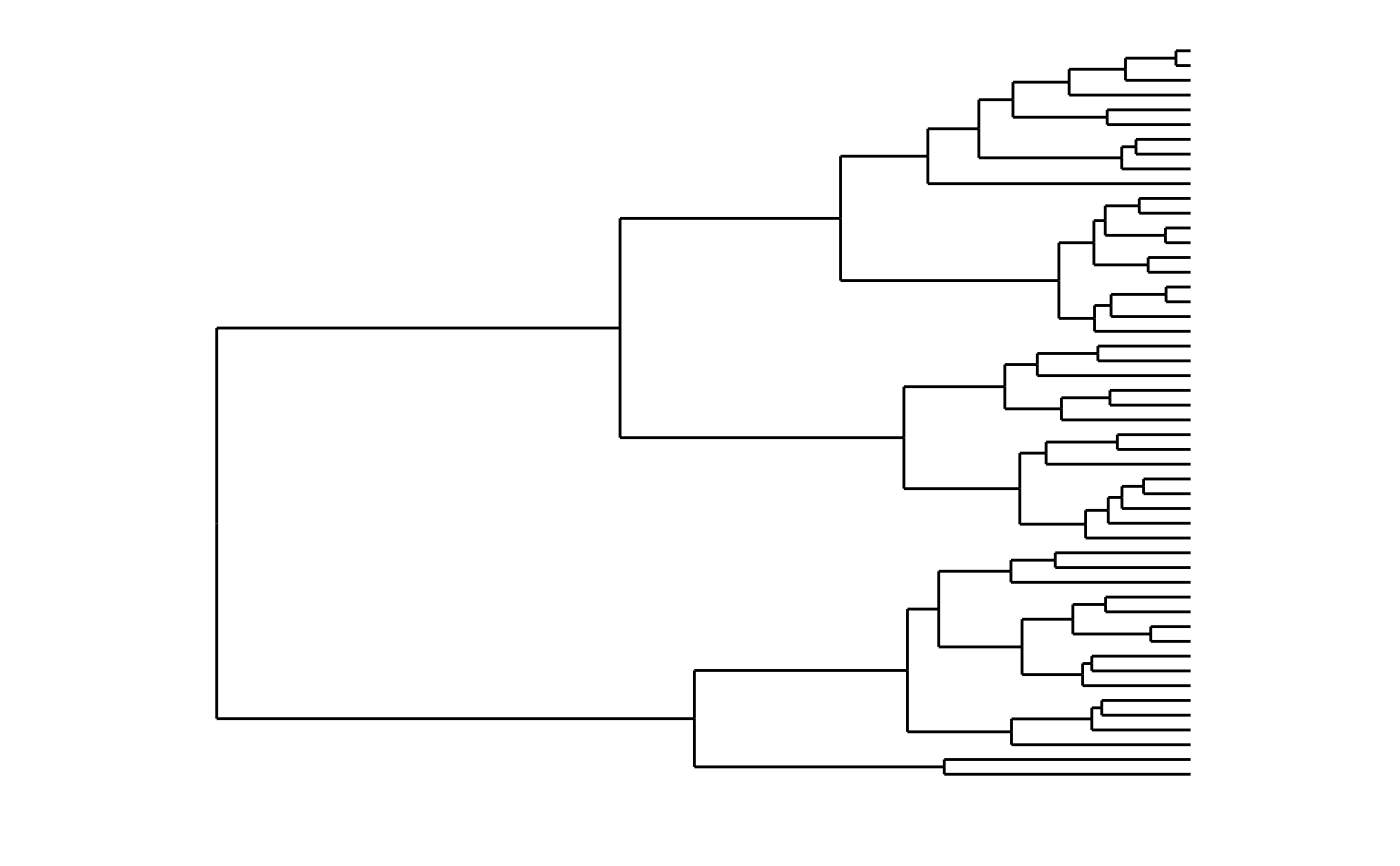
# Rectangular lines
hcdata <- dendro_data(hc, type = "rectangle")
ggplot(segment(hcdata)) +
geom_segment(aes(x = x, y = y, xend = xend, yend = yend)) +
coord_flip() +
scale_y_reverse(expand = c(0.2, 0)) +
theme_dendro()
# Demonstrate dendro_data.hclust
require(ggplot2)
hc <- hclust(dist(USArrests), "ave")
# Rectangular lines
hcdata <- dendro_data(hc, type = "rectangle")
ggplot(segment(hcdata)) +
geom_segment(aes(x = x, y = y, xend = xend, yend = yend)) +
coord_flip() +
scale_y_reverse(expand = c(0.2, 0)) +
theme_dendro()
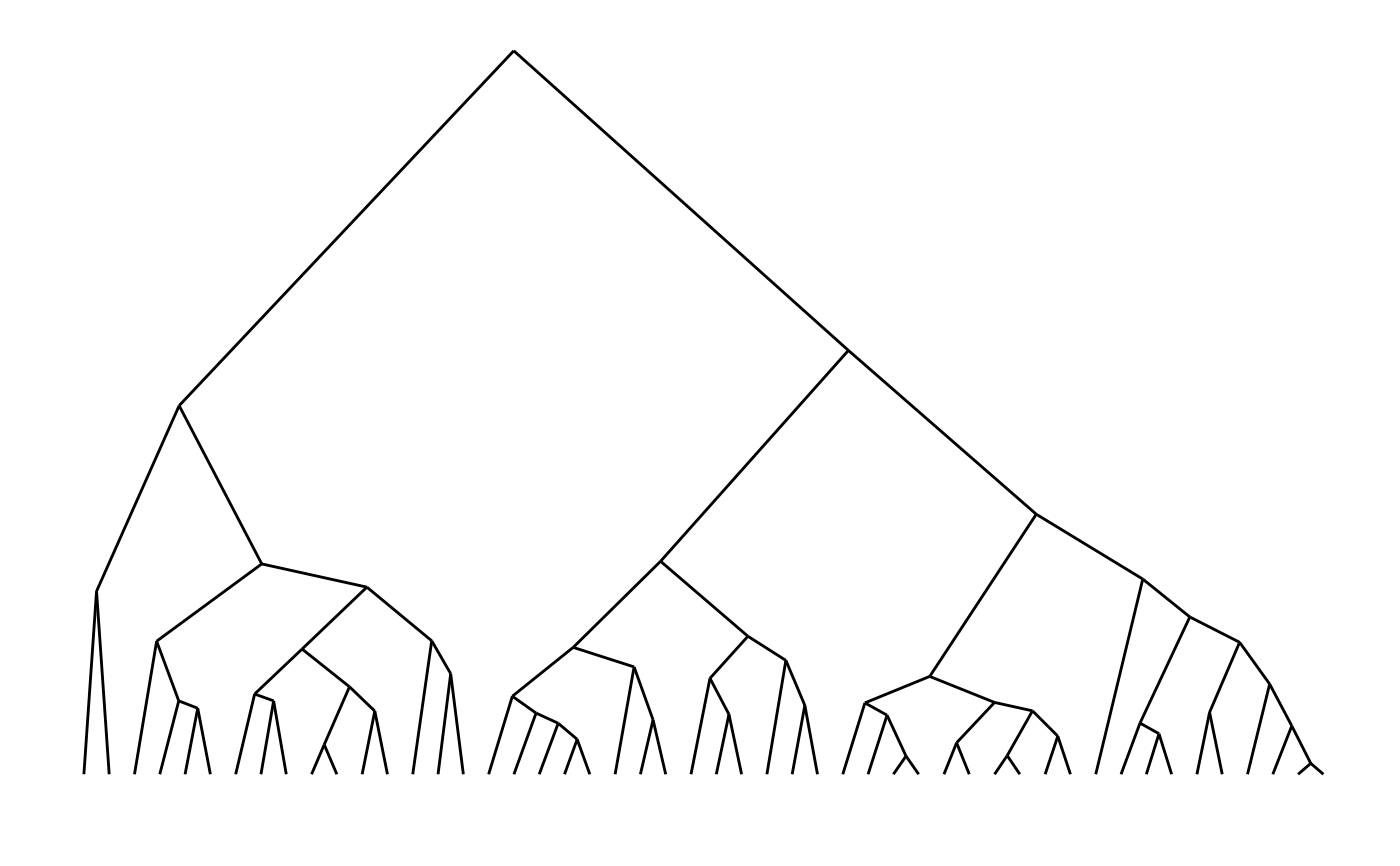
 # Triangular lines
hcdata <- dendro_data(hc, type = "triangle")
ggplot(segment(hcdata)) +
geom_segment(aes(x = x, y = y, xend = xend, yend = yend)) +
theme_dendro()
# Triangular lines
hcdata <- dendro_data(hc, type = "triangle")
ggplot(segment(hcdata)) +
geom_segment(aes(x = x, y = y, xend = xend, yend = yend)) +
theme_dendro()
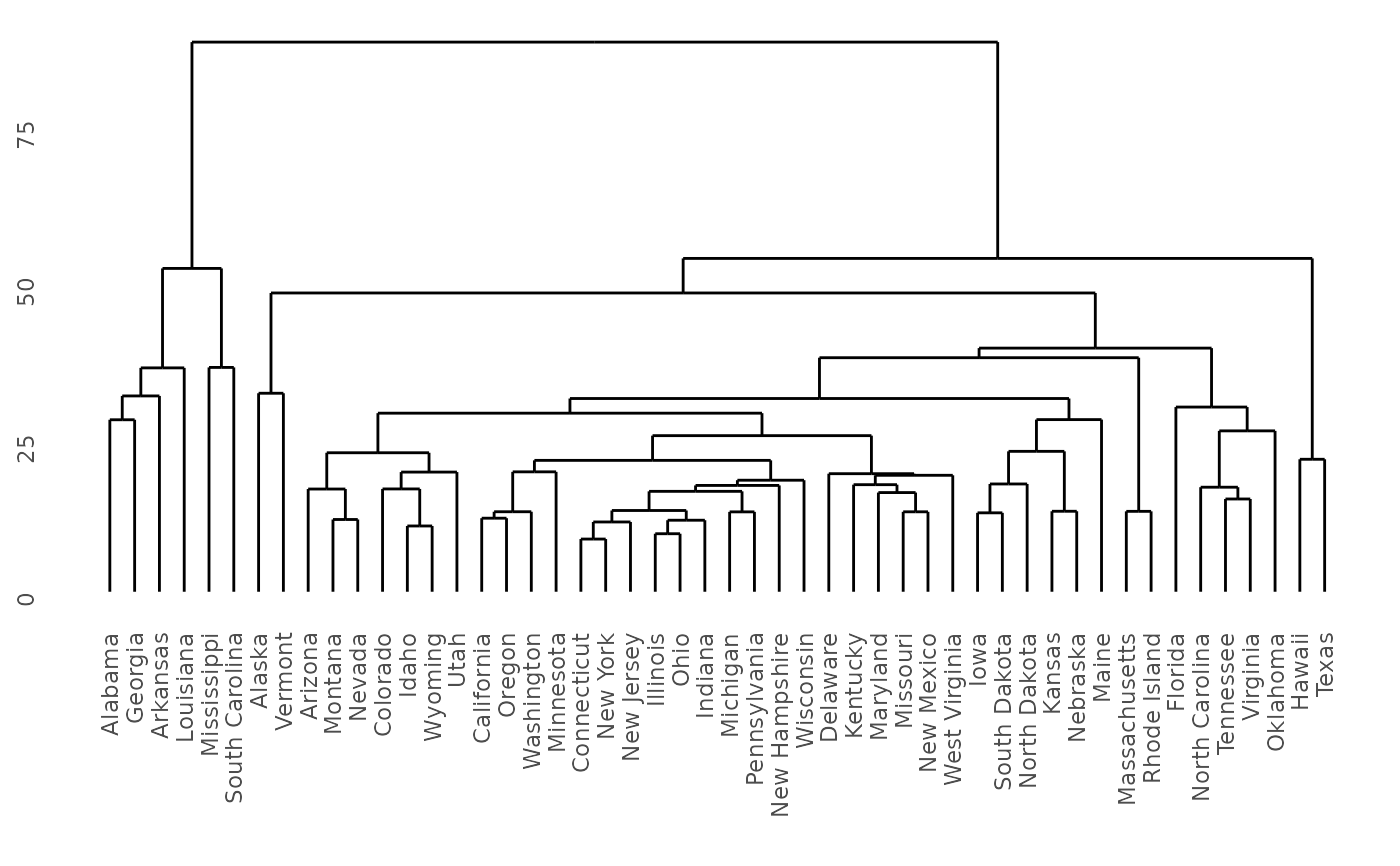
 ### Demonstrate the twins of agnes and diana, from package cluster
if (require(cluster)) {
model <- agnes(votes.repub, metric = "manhattan", stand = TRUE)
dg <- as.dendrogram(model)
ggdendrogram(dg)
}
#> Loading required package: cluster
### Demonstrate the twins of agnes and diana, from package cluster
if (require(cluster)) {
model <- agnes(votes.repub, metric = "manhattan", stand = TRUE)
dg <- as.dendrogram(model)
ggdendrogram(dg)
}
#> Loading required package: cluster
 if (require(cluster)) {
model <- diana(votes.repub, metric = "manhattan", stand = TRUE)
dg <- as.dendrogram(model)
ggdendrogram(dg)
}
if (require(cluster)) {
model <- diana(votes.repub, metric = "manhattan", stand = TRUE)
dg <- as.dendrogram(model)
ggdendrogram(dg)
}